The test gap scanner: finding untested code paths with heuristic analysis
i run a monorepo with about a dozen packages and apps. next.js frontends, trpc routers, drizzle schemas, oauth flows, webhook handlers. it's the kind of codebase where new features land faster than tests get written, and that gap only grows if you're not paying attention.
for a while i was relying on vitest with v8 coverage, and the numbers looked reasonable. somewhere in the low 70s. but i kept running into production bugs that lived in code the coverage report said was "covered." a route handler that technically executed during a test, but nobody ever checked its error branch. foreign key constraints in the schema that were syntactically correct but never actually tested under load. webhook signature verification that worked fine in the happy path but had never once been given a bad signature.
the more i dug into it, the more i realized that statement coverage was answering the wrong question. it tells you what code ran. it does not tell you what code matters that hasn't been properly tested. those are very different things.
what i actually wanted
what i was looking for was something closer to a code review that never gets tired. something that could look at the codebase and tell me: here are the 15 foreign key constraints in your schema, and 4 of them don't have a constraint test. here are your 28 route handlers, and 9 of them have never been hit with a proper http-level test. here's a webhook signature verifier, and nobody has ever tested what happens when the signature is wrong.
not line coverage. pattern coverage. the kind of thing you'd notice yourself if you sat down and carefully read through every file in the repo, but nobody has time to do that across 12,000 files.
so i built a scanner. it lives as a package in the monorepo, uses ts-morph to parse the typescript ast, and runs a set of heuristic detectors that each know how to find one specific type of untested pattern.
how the scanner works
the core loop is straightforward. it loads every source file in the repo (excluding test files and node_modules), runs every detector against each file, and then checks whether each finding is already covered by an existing test.
for (const sourceFile of sourceFiles) {
  for (const detector of DETECTORS) {
    const findings = detector(sourceFile, relPath);
    for (const finding of findings) {
      allFindings.push({
        ...finding,
        covered: isFindingCovered(finding, testDescriptions),
      });
    }
  }
}
each finding carries a file path, a line number, a suite key that ties it to an architectural category, a pattern name, a severity level, and a boolean for whether it's already covered. the suite key is the thing that makes this actually useful in practice. it means gaps are organized by what kind of test is missing rather than just which file has low coverage.
the five detectors that catch the most
each detector is a small function that takes a source file and returns an array of findings. most are between 30 and 60 lines, mostly regex.
database constraints is the one that surprised me most. it scans drizzle schema files for .references(() => table.column) and check() calls, and flags every constraint that doesn't have a corresponding test. when i first ran it, it found 45 constraints across the schema. 13 of them had no test at all.
const refMatches = text.matchAll(
  /\.references\(\s*\(\)\s*=>\s*(\w+)\.(\w+)/g,
);
for (const match of refMatches) {
  findings.push({
    suiteKey: "DB_CONSTRAINTS",
    functionName: `FK → ${match[1]}.${match[2]}`,
    pattern: ".references() FK constraint",
    severity: "high",
  });
}
route handler http finds every export function GET, POST, PUT, or DELETE in route.ts files and checks whether each one has a matching http test. this one consistently produces the most findings, because people tend to write routes quickly and backfill tests later. or not at all.
trpc router exports looks for export const *Router = router() patterns. every trpc router should have integration tests that exercise the full request-response cycle, including superjson serialization. it's easy to unit test the resolver function and think you're covered, but that misses a whole class of serialization bugs.
auth database functions targets the exported async functions in the auth package's core files, things like authorization checks, organization provisioning, and membership verification. these are the functions that gate access to everything in the system. if one of them is untested, the consequences tend to be serious.
webhook signature verification finds functions that use crypto.subtle for hmac verification. the pattern here is very specific: if you're verifying a webhook signature, you need tests for valid signatures, invalid signatures, and missing signatures. testing just the happy path is a false sense of security.
what a scan actually looks like
when you run the scanner, it walks the entire repo and prints a summary by suite. here's a trimmed version of what it looks like in the terminal:
$ pnpm test-gap-scanner scan

scanning 847 source files across 12 packages...

DB_CONSTRAINTS
  ✗ FK → users.org_id                 packages/db/schema/users.ts:34
  ✗ FK → sessions.user_id             packages/db/schema/sessions.ts:18
  ✓ FK → memberships.org_id           packages/db/schema/memberships.ts:42
  ✗ check(validRole)                  packages/db/schema/roles.ts:27
  ... 45 constraints scanned, 13 uncovered

ROUTE_HANDLER_HTTP
  ✗ POST /api/webhooks/stripe         apps/horseinc/app/api/webhooks/stripe/route.ts:8
  ✗ DELETE /api/org/[slug]/members    apps/horseinc/app/api/org/[slug]/members/route.ts:22
  ✓ GET /api/health                   apps/horseinc/app/api/health/route.ts:3
  ... 28 handlers scanned, 9 uncovered

TRPC_ROUTERS
  ✗ orgRouter                         packages/trpc/src/routers/org.ts:12
  ✓ authRouter                        packages/trpc/src/routers/auth.ts:8
  ... 11 routers scanned, 4 uncovered

AUTH_DB_FUNCTIONS
  ✗ verifyOrgMembership               packages/auth/src/org.ts:45
  ✓ createSession                     packages/auth/src/session.ts:12
  ... 9 functions scanned, 3 uncovered

WEBHOOK_VERIFICATION
  ✗ verifyStripeSignature             packages/webhooks/src/stripe.ts:7
  ... 4 verifiers scanned, 2 uncovered

summary: 97 total findings, 31 uncovered gaps
         14 high severity, 11 medium, 6 low
the ✓ / ✗ marks show you instantly which patterns have matching tests and which don't. the file path and line number on each row mean you can jump straight to the code. the summary at the bottom is what you track over time.
how coverage matching works
the part of this system i'm happiest with is how it figures out whether a finding is already covered. it doesn't look at v8 coverage data at all. instead, it builds an index of every test description in the repo, grouped by suite key. then for each finding, it extracts a token from the function name and checks if any test description in the right suite contains that token.
function isFindingCovered(finding, testDescriptions): boolean {
  const descriptions = testDescriptions.get(finding.suiteKey);
  if (!descriptions?.length) return false;

  const token = extractCoverageToken(finding.functionName).toLowerCase();
  return descriptions.some((d) => d.toLowerCase().includes(token));
}
so if the scanner finds FK → users.org_id and there's a test in the DB_CONSTRAINTS suite whose description mentions "users", it marks that finding as covered. this is deliberately loose. i tried exact matching at first and it was too brittle, because test descriptions are written by people and they don't perfectly mirror function signatures. with the loose approach, "should enforce org_id foreign key on users table" correctly covers FK → users.org_id.
the false positive rate is low enough that i don't worry about it. a handful of extra "covered" marks are perfectly acceptable. the goal isn't perfect precision. the goal is finding the things that are completely untested.
the dashboard and the work queue
scanner results get stored in supabase through an edge function. three tables: reports (one row per scan run), findings (individual gaps with a covered boolean), and summaries (aggregated counts by suite and severity).
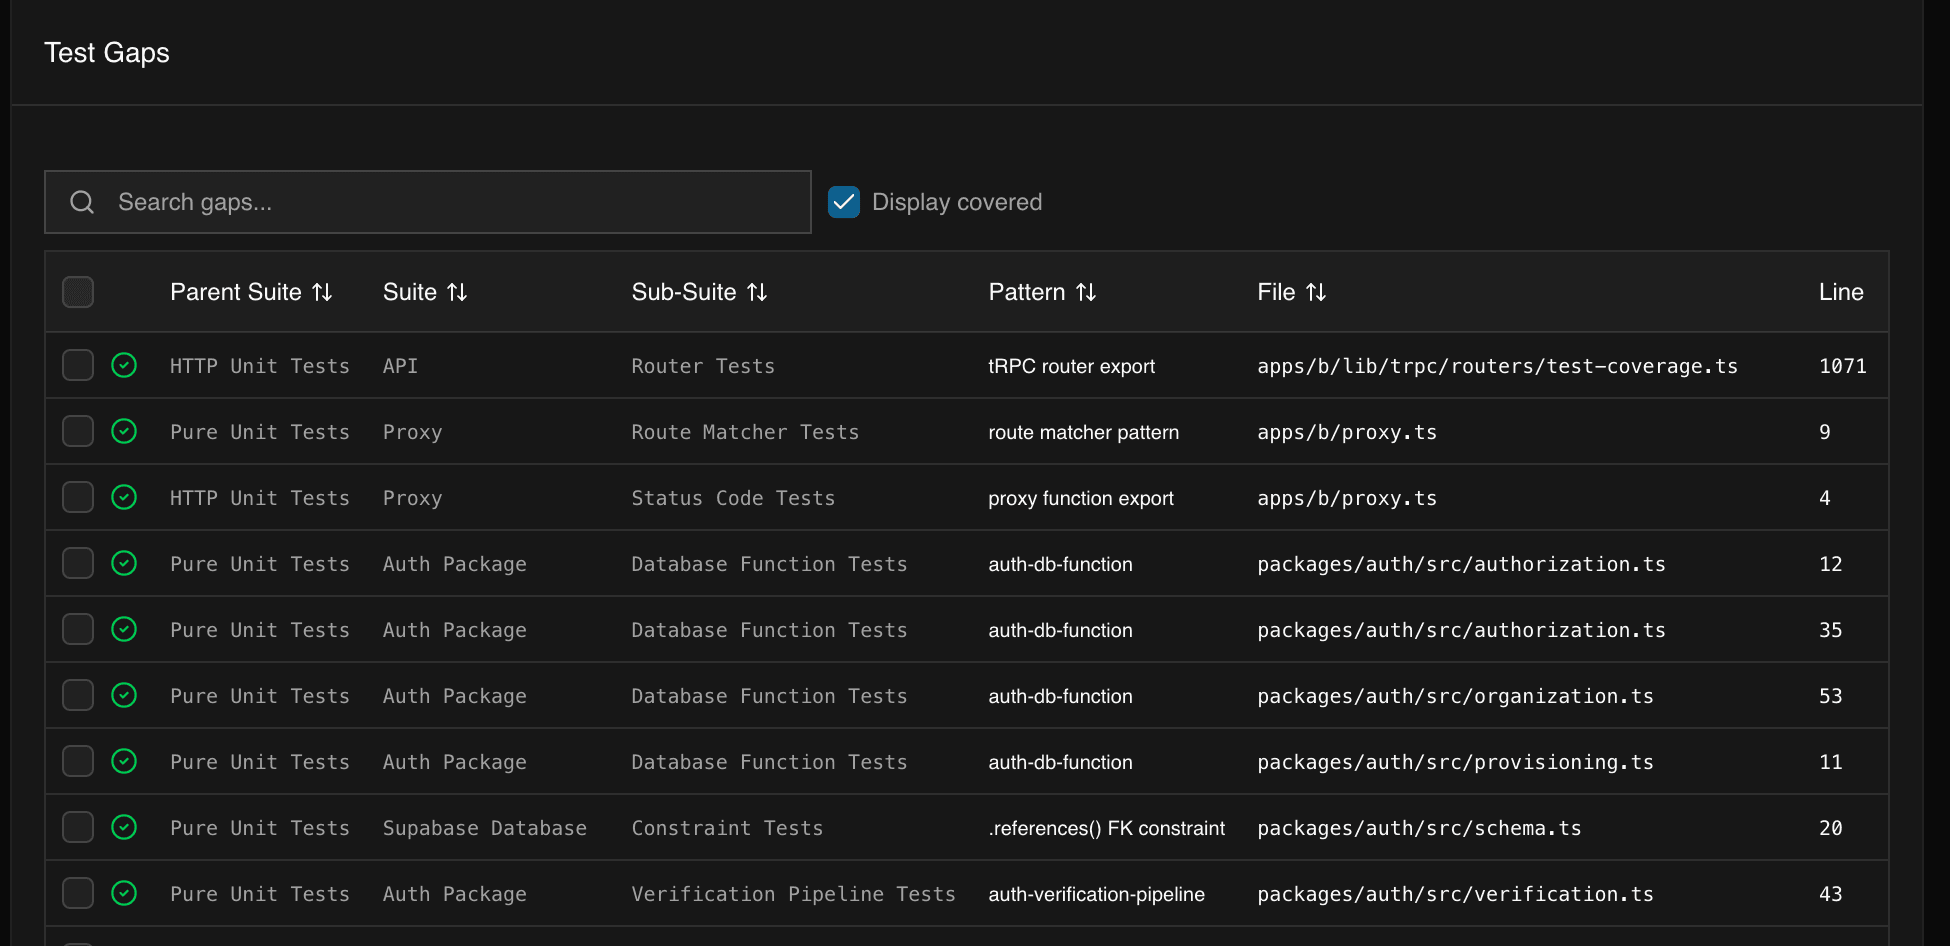
the dashboard is where the scanner stops being a one-off script and starts being a workflow. the gaps tab shows every uncovered finding as a filterable, searchable table. you can narrow by suite (show me just the database constraint gaps), by severity (what's high-priority right now), or by coverage status (hide what's already been addressed). every row links back to the source file and line number, so you're one click away from the code.
the daily flow looks like this: the scanner runs on main after every merge. results get pushed to supabase, the dashboard updates, and the gap count on the summary tab either goes up or down. when you open the dashboard, the first thing you see is the trend — total gaps over the last 30 days, broken down by suite. a downward line means the team is closing gaps faster than new code introduces them. an upward line means it's time to schedule a test-writing session.
for actually writing the tests, the cli has a work-queue command that pulls uncovered findings and groups them by pattern type. instead of context-switching between "fix a route handler test" and "add a constraint test" and "write an auth test," you get a batch like: here are the 9 uncovered route handlers, write them all. grouping related gaps together means you build momentum — by the third test in a batch, you're moving fast because the setup is the same and you already have the patterns in your head.
how it fits into ci
the scanner runs as a github actions check on every pull request. it compares the scan results against the baseline from main and posts a pr comment with three things: new gaps introduced by this pr, existing gaps that this pr fixes, and the net change.
the rule we settled on: new code cannot introduce high-severity uncovered gaps. if your pr adds a new route handler and doesn't include an http test for it, the check fails and blocks the merge. medium and low severity gaps produce warnings but don't block — they get added to the backlog for the next test-writing batch.
# .github/workflows/test-gaps.yml (simplified)
- name: scan for test gaps
  run: pnpm test-gap-scanner scan --json > gaps.json

- name: compare against baseline
  run: pnpm test-gap-scanner diff --baseline main --current gaps.json

- name: post pr comment
  run: pnpm test-gap-scanner comment --pr ${{ github.event.number }}
this turns "improve test coverage" from a periodic chore into a continuous gate. engineers see the gap count on every pr, and the high-severity block means the most critical patterns never slip through without tests. it also means you never have to argue about whether a pr needs tests — the scanner decides based on what the code actually does, not on a line-coverage threshold.
what i've learned from running this
heuristics are more actionable than coverage numbers. telling someone "schema.ts is 60% covered" doesn't help them. telling them "these 13 FK constraints have no test" gives them a clear list of things to write.
loose matching is the right tradeoff. approximate matching with a low false-negative rate is more useful than precise matching that misses real gaps. when in doubt, mark something as uncovered. writing one extra test is always cheaper than missing a real gap in production.
organizing by architecture beats organizing by file. grouping gaps into categories like "database constraints" and "route handlers" and "oauth flows" turned out to matter a lot. developers think in terms of systems, not file paths. "i need to test the auth flow" is a much more natural unit of work than "i need to improve coverage on line 47 of auth.ts."
the scanner currently reports around 175 uncovered gaps across the monorepo. when i first ran it, that number was above 400. watching it go down over time as the team writes tests has been genuinely motivating. it turns "improve test coverage" from a vague aspiration into a concrete backlog you can chip away at week by week.